
Calculator User Manual

Chapter 19: Applications
255
19APPS.DOC TI-86, Chap 19, US English Bob Fedorisko Revised: 02/13/01 2:41 PM Printed: 02/13/01 3:05 PM Page 255 of 1819APPS.DOC TI-86, Chap 19, US English Bob Fedorisko Revised: 02/13/01 2:41 PM Printed: 02/13/01 3:05 PM Page 255 of 18
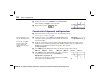
Select
TOL
from the
MEM
menu and set
tol=1
.
On the mode screen, set
Radian
angle mode and
Param
graphing mode.
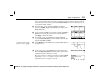
In the equation editor, enter the parametric equations for the power series approximation as
shown. Select
sum
and
seq
from the
LIST
OPS
menu. Select
!
from the
MATH
PROB
menu.
»xt1=t yt1=sum seq((
L
1)^(j+1)t^(2j
N
1)
à
((2j
N
1)(2j
N
1)!),j,1,10,1)
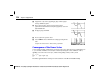
In the equation editor, enter the parametric equations as shown to plot the antiderivative of (sin x)
à
x
and compare it with the plot of the power series approximation. (Select
fnInt
from the
CALC
menu.)
¼xt2=t yt2=fnInt((sin w)
à
w,w,0,t)
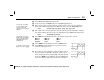
Select
WIND
from the
GRAPH
menu and set the window variable values as shown.
tMin=
L
15 xMin=
L
15 yMin=
L
3
tMax=15 xMax=15 yMax=3
tStep=0.5 xScl=1 yScl=1
Select
FORMT
from the
GRAPH
menu and set
SimulG
format.
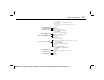
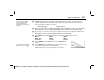
Select
GRAPH
from the
GRAPH
menu to plot the parametric
equations on the graph screen.
In the equation editor, modify
yt1
to compute the first 16 terms of
the power series by changing
10
to
16
. Plot the equations again.
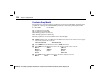
In this example, the window variable
tStep
controls the plotting
speed. Select
WIND
from the
GRAPH
menu and set
tStep=1
and
observe the difference in plotting speed and curve smoothness.
If necessary, select
ALL
N
from the equation editor
menu to deselect all
functions. Also, turn off all
stat plots.
This example is set up in
Param
mode, which allows
you to control the solution
with
tStep
and increase
plotting speed.
To clear the menus from the
graph screen, press
:
.