
Calculator User Manual

Chapter 19: Applications
257
19APPS.DOC TI-86, Chap 19, US English Bob Fedorisko Revised: 02/13/01 2:41 PM Printed: 02/13/01 3:05 PM Page 257 of 1819APPS.DOC TI-86, Chap 19, US English Bob Fedorisko Revised: 02/13/01 2:41 PM Printed: 02/13/01 3:05 PM Page 257 of 18
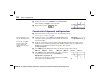
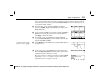
In
Param
graphing mode, select
E(t)=
from the
GRAPH
menu and enter the equations in the
equation editor as shown. This pair of equations plots the path of the water stream when the
valve is installed at a height of 0.5 meters.
»xt1=t
‡
(2g(2
N
0.5)) yt1=0.5
N
(g¹t
2
)
à
2
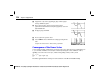
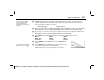
Move the cursor to
xt2=.
Press - – ' 1
1
, and press b to recall the contents of
xt1
into
xt2
. For
xt2
, change the valve height (which is
0.5
) to
0.75
meters. Do the same with
yt1
and
yt2
.
Repeat step 3 to create three more pairs of equations. Change the valve height to
1.0
meters for
xt3
and
yt3
,
1.5
meters for
xt4
and
yt4
, and
1.75
meters for
xt5
and
yt5
.
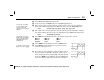
Select
WIND
from the
GRAPH
menu and set the window variable values as shown.
tMin=0 xMin=0 yMin=0
tMax=
‡
(4
à
g) xMax=2 yMax=2
tStep=0.01 xScl=0.5 yScl=0.5
Select
FORMT
from the
GRAPH
menu and set
SimulG
graph
format.
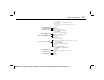
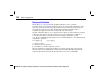
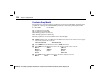
Select
GRAPH
from the
GRAPH
menu to plot the trajectory of
the water jets from the five specified heights.
Which height seems to create the longest water stream?
If necessary, select
ALL
N
from the equation editor
menu to deselect all
functions. Also, turn off all
stat plots.
To clear the menus from the
graph screen, press
:
.