
Calculator User Manual


Chapter 19: Applications
259
19APPS.DOC TI-86, Chap 19, US English Bob Fedorisko Revised: 02/13/01 2:41 PM Printed: 02/13/01 3:05 PM Page 259 of 1819APPS.DOC TI-86, Chap 19, US English Bob Fedorisko Revised: 02/13/01 2:41 PM Printed: 02/13/01 3:05 PM Page 259 of 18
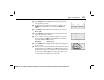
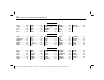
Select
GRAPH
from the
GRAPH
menu to plot the graph of the
two populations over time.
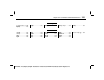
To see the direction field of the phase-plane solution, select
FORMT
from the
GRAPH
screen, and then set
DirFld
field
format.
Select
INITC
from the
GRAPH
menu and delete the values for
Q
[
1
and
Q
[
2
.
Select
GRAPH
from the
GRAPH
menu to display the direction
field of the phase-plane solution.
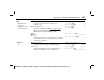
To see a family of specific phase-plane solutions on top of the
direction field, select
INITC
from the
GRAPH
menu, and then
enter lists for
Q
[
1
and
Q
[
2
as shown.
Q
[
1={2,6,7} Q
[
2={6,12,18}
쐅
Select
TRACE
from the
GRAPH
menu to display the graph with
the trace cursor.
쐈
Press
3
to see how many foxes and how many rabbits are alive at
t=3
. (Round the values of
Q1
(foxes) and
Q2
(rabbits) to whole
numbers.) How many foxes and rabbits are alive at
t=6
? at
t=12
?
On what value of
Q1
and
Q2
do the phase-plane orbits seem to
converge? What is the significance of this value?