
Calculator User Manual


Chapter 20: A to Z Function and Instruction Reference
335
20ATOZ.DOC TI-86, Chap 20, US English Bob Fedorisko Revised: 02/13/01 2:42 PM Printed: 02/13/01 3:05 PM Page 335 of 11820ATOZ.DOC TI-86, Chap 20, US English Bob Fedorisko Revised: 02/13/01 2:42 PM Printed: 02/13/01 3:05 PM Page 335 of 118
Plot1(
Plot2(
Plot3(
† STAT PLOT menu
The syntax and
descriptions to the right
refer to
Plot1(
, but they
apply as well to
Plot2(
and
Plot3(
.
Scatter plot ®
Plot1(1,
xListName
,
yListName
,
mark
)
Plot1(1,
xListName
,
yListName
)
Defines and selects the plot using real data pairs in
xListName
and
yListName
.
The optional
mark
specifies the character used to plot
the points. If you omit
mark
, a box is used.
mark
:
1
= box (
›
)
2
= cross (+)
3
= dot (
¦
)
xyLine plot −
Plot1(2,
xListName
,
yListName
,
mark
)
Plot1(2,
xListName
,
yListName
)
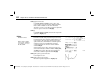
{
L
9,
L
6,
L
4,
L
1,2,5,7,10}
¶
L1
b
{
L
9
L
6
L
4
L
1 2 5 7 1…
{
L
7,
L
6,
L
2,1,3,6,7,9}
¶
L2
b
{
L
7
L
6
L
2 1 3 6 7 9}
Plot1(1,L1,L2)
b
Done
ZStd
b
Modified box plot ¯
Plot1(3,
xListName
,1
or frequencyListName
,
mark
)
Plot1(3,
xListName
,1
or frequencyListName
)
Plot1(3,
xListName
)
Defines and selects the plot using real data points in
xListName
with the specified frequencies. If you omit
1
or frequencyListName
, frequencies of 1 are used.
Histogram ¬
Plot1(4,
xListName
,1
or frequencyListName
)
Plot1(4,
xListName
)
Box plot °
Plot1(5,
xListName
,1
or frequencyListName
)
Plot1(5,
xListName
)