
Calculator User Manual


Chapter 20: A to Z Function and Instruction Reference
349
20ATOZ.DOC TI-86, Chap 20, US English Bob Fedorisko Revised: 02/13/01 2:42 PM Printed: 02/13/01 3:05 PM Page 349 of 11820ATOZ.DOC TI-86, Chap 20, US English Bob Fedorisko Revised: 02/13/01 2:42 PM Printed: 02/13/01 3:05 PM Page 349 of 118
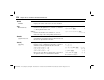
Scatter
† STAT DRAW menu
(Scatte shows
on menu)
Scatter
xList
,
yList
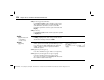
Draws a scatter plot on the current graph, using the real
data pairs in
xList
and
yList
.
Scatter
Uses the data in built-in variables
xStat
and
yStat
. These
variables must contain valid data of the same
dimension; otherwise, an error occurs.
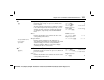
{
L
9,
L
6,
L
4,
L
1,2,5,7,10}
¶
XL
b
{
L
9
L
6
L
4
L
1 2 5 7 1…
{
L
7,
L
6,
L
2,1,3,6,7,9}
¶
YL
b
{
L
7
L
6
L
2 1 3 6 7 9}
ZStd:Scatter XL,YL
b
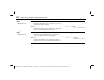
Sci
† mode screen
Sci
Sets scientific notation display mode.
In
Sci
notation mode:
123456789
b
1.23456789
E
8
In
Normal
notation mode:
123456789
b
123456789