
Calculator User Manual


350
Chapter 20: A to Z Function and Instruction Reference
20ATOZ.DOC TI-86, Chap 20, US English Bob Fedorisko Revised: 02/13/01 2:42 PM Printed: 02/13/01 3:05 PM Page 350 of 118
Select(
LIST OPS menu
Select(
xListName
,
yListName
)
If a scatter plot or xyline plot is currently selected and
plotted on the graph screen, you can select a subset
(range) of those data points. The selected data points
are stored to
xListName
and
yListName
.
Select(
xListName
,
yListName
)
displays the current
graph screen and starts an interactive session during
which you select a range of data points.
a. Move the cursor to the leftmost (left bound) point of
the range you want to select and press b.
b. Then move the cursor to the rightmost (right bound)
point of the range you want to select and press
b.
A new stat plot of
xListName
and
yListName
replaces
the plot from which you selected the points.
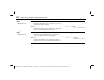
{
L
9,
L
6,
L
4,
L
1,2,5,7,10}
¶
L1
b
{
L
9
L
6
L
4
L
1 2 5 7 1…
{
L
7,
L
6,
L
2,1,3,6,7,9}
¶
L2
b
{
L
7
L
6
L
2 1 3 6 7 9}
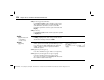
Plot1(1,L1,L2):ZStd
b
After the graph is displayed:
Select(L10,L20)
b
Move the cursor to point (2,3) and press
b
. Then move to (10,9) and press
b
.
L10
b
{2 5 7 10}
L20
b
{3 6 7 9}
Send(
‡ program editor
I/O menu
Send(
listName
)
Sends the contents of
listName
to the CBL or CBR
System.
{1,2,3,4,5}
¶
L1:Send(L1)
b
Done