
Calculator User Manual

Chapter 5: Function Graphing
75
05FUNC.DOC TI-86, Chap 5, US English Bob Fedorisko Revised: 02/13/01 2:22 PM Printed: 02/13/01 3:01 PM Page 75 of 14
Each graphing mode has a unique equation editor. You must select the graphing mode and
Dec
number base mode before you enter the functions. The TI
-
86 retains in memory all
equations stored to the
Func
,
Pol
,
Param
, and
DifEq
equation editors. Each mode also has
unique graph format settings and window variables.
Stat plot on
à
off status, zoom factors, mode settings, and tolerance apply to all graphing
modes; changing the graphing mode does not affect them.
These mode settings affect graphing results.
♦
Radian
or
Degree
angle mode affects the interpretation of some functions.
♦
dxDer1
or
dxNDer
differentiation mode affects plotting of selected functions.
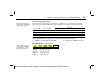
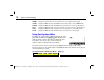
The GRAPH Menu
6
y(x)= WIND ZOOM TRACE GRAPH
4
MATH DRAW FORMT STGDB RCGDB
4
EVAL STPIC RCPIC
y(x)=
Displays the equation editor; use this screen to enter functions to be graphed
WIND
Displays the window editor; use this editor to change graph screen dimensions
ZOOM
Displays the
GRAPH
ZOOM
menu; use these items to change the graph screen dimensions
TRACE
Activates the trace cursor; use this cursor to trace along the graph of a specific function
GRAPH
Displays the graph screen; graphs all selected functions and turned on stat plots
MATH
Displays the
GRAPH
MATH
menu; use this menu to explore graphs mathematically
DRAW
Displays the
GRAPH
DRAW
menu; use this menu to draw on graphs or test pixels
Chapter 1 describes all mode
settings in detail.
Chapter 6 describes these
GRAPH
menu items:
ZOOM
,
TRACE
,
MATH
,
DRAW
,
STGDB
,
RCGDB
,
EVAL
,
STPIC
, and
RCPIC
.