
Calculator User Manual

80
Chapter 5: Function Graphing
05FUNC.DOC TI-86, Chap 5, US English Bob Fedorisko Revised: 02/13/01 2:22 PM Printed: 02/13/01 3:01 PM Page 80 of 14
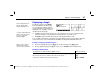
Setting the Graph Style in the Equation Editor
Display the equation editor.
Move the cursor to the function or functions for
which you want to set the graph style.
6 &
#
Display the equation editor menu item
STYLE
.
Select
STYLE
repeatedly to scroll the graph
style icons to the left of the equation name.
/
( (
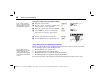
View the graph with the new graph style.
Clear the
GRAPH
menu to view the graph only.
- *
:
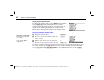
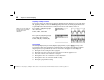
Using Shading Patterns to Differentiate Functions
When you select
¾
(shade above) or
¿
(shade below) for more than one function, the TI
-
86
rotates through a series of four shading patterns.
♦
First shaded function: vertical lines
♦
Second shaded function: horizontal lines
♦
Third shaded function: negatively sloping diagonal lines
♦
Fourth shaded function: positively sloping diagonal lines
The rotation returns to vertical lines for the fifth shaded function and repeats the order.
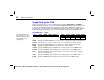
In the example,
¾
(shade
above) is selected for
y2
. All
window variables are set to
the default values (page 82).
If you assign
¾
or
¿
to a
function that graphs a family
of curves (page 86), the
same pattern rotation applies
to the members of the family
of curves.