
Calculator User Manual

Chapter 5: Function Graphing
81
05FUNC.DOC TI-86, Chap 5, US English Bob Fedorisko Revised: 02/13/01 2:22 PM Printed: 02/13/01 3:01 PM Page 81 of 14
Viewing and Changing On
à
Off Status of Stat Plots
Plot1 Plot2 Plot3
on the top line of the equation editor displays the on
à
off status of each stat
plot (Chapter 14). When a plot name is highlighted on this line, the plot is on.
To change the on
à
off status of a stat plot from the equation editor, press
$
,
"
, and
!
to
place the cursor on
Plot1
,
Plot2
, or
Plot3
, and then press
b
.
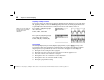
Setting the Window Variables
The graph screen window represents the portion of the
coordinate plane displayed on the graph screen. By setting
window variables, you can define the graph screen window
boundaries and other attributes.
xMin
,
xMax
,
yMin
, and
yMax
are the graph screen boundaries.
xScl
(x scale) is the number of units represented by the distance from one tick mark to the next
tick mark on the x-axis.
yScl
(y scale) is the number of units represented by the distance from one tick mark to the
next tick mark on the y-axis.
xRes
sets pixel resolution for function graphs only, using integers
1
through
8
.
♦
At
xRes=1
(the default), functions are evaluated and graphed at each pixel on the x-axis.
♦
At
xRes=8
, functions are evaluated and graphed at every eighth pixel along the x-axis.
To remove tick marks from
both axes, set
xScl=0
and
yScl=0
.
Small
xRes
values improve
graph resolution but may
cause the TI
-
86 to plot
graphs more slowly
.