
Calculator User Manual

Chapter 5: Function Graphing
83
05FUNC.DOC TI-86, Chap 5, US English Bob Fedorisko Revised: 02/13/01 2:22 PM Printed: 02/13/01 3:01 PM Page 83 of 14
Setting Graphing Accuracy with
@
x and
@
y
The window variables
@
x
and
@
y
define the distance from the center of one pixel to the
center of any adjacent pixel. When you display a graph, the values of
@
x
and
@
y
are
calculated from
xMin
,
xMax
,
yMin
, and
yMax
using these formulas:
@
x
=(
xMin
+
xMax
)
à
126
@
y
=(
yMin
+
yMax
)
à
62
@
x
and
@
y
are not on the window editor. To change them, you must follow the steps above
for changing a window variable value from the home screen or in the program editor. When
you change the values stored to
@
x
and
@
y
, the TI
-
86 automatically recalculates
xMax
and
yMax
from
@
x
,
xMin
,
@
y
, and
yMin
, and the new values are stored.
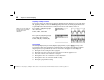
Setting the Graph Format
To display the graph format screen, select
FORMT
from the
GRAPH
menu (
6
/
(
). The graph format settings
define various characteristics of the displayed graph. The
current settings are highlighted.
To change a setting, move the cursor onto the new setting,
and then press
b
, the same as on the mode screen.
The TI
-
86 retains
independent format settings
for each graphing mode.
In
DifEq
graphing mode, the
graph format screen key
sequence is
6
/
&
(Chapter 10).