
Calculator User Manual

84
Chapter 5: Function Graphing
05FUNC.DOC TI-86, Chap 5, US English Bob Fedorisko Revised: 02/13/01 2:22 PM Printed: 02/13/01 3:01 PM Page 84 of 14
RectGC
Displays the cursor location as rectangular graph coordinates
x
and
y
; when
RectGC
is set, plotting the graph, moving the free-moving cursor, and tracing update
x
and
y
; if
CoordOn
format also is selected,
x
and
y
are displayed
PolarGC
Displays the cursor location as polar graph coordinates
R
and
q
; when
PolarGC
is set,
plotting the graph, moving the free-moving cursor, and tracing update
x
,
y
,
R
and
q
; if
CoordOn
format also is selected,
R
and
q
are displayed
CoordOn
Displays the cursor coordinates at the bottom of the graph
CoordOff
Does not display the cursor coordinates at the bottom of the graph
DrawLine
Draws a line between the points calculated for the functions in the equation editor
DrawDot
Plots only the calculated points for the functions in the equation editor
SeqG
(sequential graphing) Evaluates and plots one function completely before evaluating
and plotting the next function
SimulG
(simultaneous graphing) Evaluates and plots all selected functions for a single value
of
x
and then evaluates and plots them for the next value of
x
GridOff
Omits the grid points from the display
GridOn
Displays grid points
AxesOn
Displays the axes
AxesOff
Omits the axes from the display;
AxesOff
overrides the
LabelOffàLabelOn
format
setting
LabelOff
Omits the axis labels from the display
LabelOn
Labels the axes, if
AxesOn
is also selected;
x
and
y
for
Func
,
Pol
, and
Param
modes;
various labels in
DifEq
mode
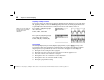
DifEq
graphing mode has a
unique set of graph format
settings (Chapter 10).
Grid points cover the graph
screen in rows that
correspond to the tick marks
on each axis.