
Calculator User Manual

Chapter 5: Function Graphing
85
05FUNC.DOC TI-86, Chap 5, US English Bob Fedorisko Revised: 02/13/01 2:22 PM Printed: 02/13/01 3:01 PM Page 85 of 14
Displaying a Graph
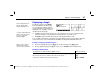
To display a graph, select
GRAPH
from the
GRAPH
menu. The graph
screen is displayed. If the graph is
newly defined, the busy indicator is
displayed at the top-right corner as
the TI
-
86 draws the graph.
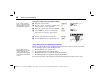
♦
In
SeqG
format, the TI
-
86 draws each selected function one by one, in function-name
order (for example,
y1
is graphed first,
y2
is graphed second, and so on).
♦
In
SimulG
format, the TI
-
86 draws all selected graphs simultaneously.
You can display and explore a graph from a program (Chapter 16). To use graphing commands
on the home screen, select them from the
CATALOG
or entering the individual characters.
Pausing or Stopping a Graph in Progress
♦
To pause graph plotting, press
b
. To resume plotting, press
b
again.
♦
To stop graph plotting, press
^
. To replot, select
GRAPH
from the
GRAPH
menu.
Modifying a Drawn Graph
To remove these items from the graph screen: Press (or select):
Cursor, coordinate values, or menus (To restore menus, press
.
or
6
)
:
Free-moving cursor and coordinate values but not the menus
b
Cursor and coordinate values but not the menus
6
or
GRAPH
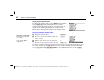
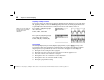
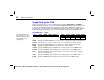
In the example graph to the
right, all default settings
related to graphing are set.
To view the graph without the
GRAPH
menu on the bottom
line, press
:
after
plotting the graph.
When you pause, the busy
indicator in the top-right
corner becomes a dotted line.