
Calculator User Manual

86
Chapter 5: Function Graphing
05FUNC.DOC TI-86, Chap 5, US English Bob Fedorisko Revised: 02/13/01 2:22 PM Printed: 02/13/01 3:01 PM Page 86 of 14
Graphing a Family of Curves
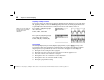
If you enter a list as an element in an equation, the TI
-
86 plots the function for each value in the
list, graphing a family of curves. In
SimulG
graphing order mode, the TI
-
86 graphs all functions
sequentially for the first element in each list, then for the second element, and so on.
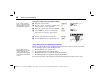
For example,
{2,4,6} sin x
graphs
three functions:
2 sin x
,
4 sin x
, and
6 sin x
.
The equation
{2,4,6} sin ({1,2,3} x)
also graphs three functions:
2 sin x
,
4 sin (2x)
, and
6 sin (3x)
.
Smart Graph
Smart Graph displays the previously displayed graph when you press
6
, as long as all
factors that would cause replotting are unchanged since the graph was last displayed. Smart
Graph replots if you performed any of these actions since the graph was last displayed.
♦
Changed a mode setting that affects graphs
♦
Changed a function or stat plot that was plotted on the last graph screen
♦
Selected or deselected a function or stat plot
♦
Changed the value of a variable in a selected function
♦
Changed the value of a window variable setting
♦
Changed a graph format setting
When you use more than one
list in an expression, all lists
must have the same
dimension.