
Operation Manual


128 Running interactive activities
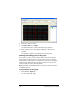
The tab opens displaying the graph and the current equations.
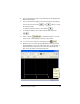
3. Click the button.
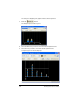
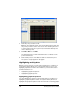
The Frequency Plot window opens.
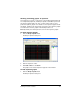
4. Select the Data Set you want to view from the dropdown menu.
5. Select the list you want to view from the dropdown menu.
A frequency plot for the list displays.