
Operation Manual

Running interactive activities 73
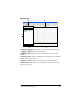
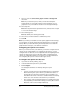
4. (Optional) Click Create New Lists and create new lists.
5. Select Choose from Data Sets.
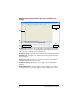
6. From the data set drop-down list, select the data set where you want
to add the collected data.
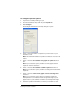
7. (Optional) Configure the plots:
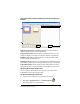
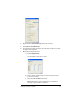
a) Click
Configure Plots.
The Plot Options dialog box opens.
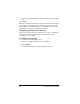
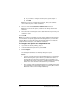
b) Next to the plot symbol that you want, select the lists for
your X and Y values.
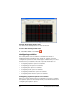
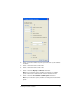
c) Select the
Plot on device check box.
Note: Selecting this option makes the plot available for
viewing on your students’ calculators.