First Steps with TI-Nspire ™ First Steps with Technology for teaching and learning mathematics Seven Introductory Tutorials for the Handheld © 2012 Texas Instruments Education Technology Page 1
First Steps with TI-Nspire ™ About this document This document includes seven introductory tutorials to take new users through many key features of TI-Nspire™ maths and science learning technology. This technology includes both handhelds and computer software, providing teachers the flexibility to meet different classroom needs. However, the primary focus of these tutorials is the handheld device.
First Steps with TI-Nspire ™ Contents TI-Nspire Keypad Layout................................................................................................... Page 5 Tutorial 1...........................................................................................................................
First Steps with TI-Nspire ™ Tutorial 5......................................................................................................................... Page 35 Geometry • The Plane Geometry and Graphing views • Lines, segments and rays • Construction of parallel lines • Drawing and labelling points on objects • Construction of shapes • Selecting and grabbing screen objects • Making measurements and storing as variables • Attributes which change the appearance and lock screen objects Tutorial 6..
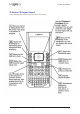
First Steps with TI-Nspire ™ TI-Nspire CX Keypad Layout Start by spending a few seconds looking at the layout of the keypad.
First Steps with TI-Nspire Tutorial 1: TI-Nspire documents ™ Tutorial 1 TI-Nspire Documents This first tutorial introduces some of the key features of TI-Nspire™ learning technology, in particular the structure of TI-Nspire documents, with different applications operating on different pages. The various menus are introduced, as well as creating and navigating around documents.
First Steps with TI-Nspire Tutorial 1: TI-Nspire documents ™ Battery Life The TI-Nspire™ CX handheld comes with a rechargeable battery, which should be charged for at least six hours before first use. The built-in rechargeable battery does not need to be removed from the handheld in order to recharge it. The handheld will still work and can be used while it is charging. With use of 2 hours per day at the default brightness level the battery should last for up to 10 days.
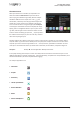
First Steps with TI-Nspire Tutorial 1: TI-Nspire documents ™ The Home Screen When you switched on a calculator you expected to see what was called the Home Screen and you’d be able to start carrying out calculations right away. But the TI-Nspire handheld is different in this respect too. Press c, the home button, a black key at the top right of the keypad. You should see a screen similar to this. Navigate to the various icons on the Home Screen using the large square Touchpad on the keypad.
First Steps with TI-Nspire Tutorial 1: TI-Nspire documents ™ What is quite different from the computer is that within one document you can have multiple pages or problems that can make use of the different applications. The spreadsheet on one page of a document can interact seamlessly with calculations done on a calculator page and graphs drawn on another. You can also have more than one different representation on one page.
First Steps with TI-Nspire Tutorial 1: TI-Nspire documents ™ Scratchpad Because there are some occasions when you really just want to carry out a quick calculation or draw a quick graph the TI-Nspire includes a feature called the Scratchpad. The scratchpad is designed for those casual throw-away calculations that need to be done from time to time, but are not worth keeping in a full document. To access the Scratchpad press ». This opens a calculator page for performing quick calculations.
First Steps with TI-Nspire Tutorial 1: TI-Nspire documents ™ If the handheld has been used previously you will see a dialog box asking you if you want to save the document that is currently open. Unless you want to save your previous work press e or ¢ to move the highlight to No. To confirm this choice press ·. e is often used to move to and highlight different parts of the screen Navigating Documents When the document opens you may see a screen similar to the one shown on the left.
First Steps with TI-Nspire Tutorial 1: TI-Nspire documents ™ Scroll downwards with the Touchpad and you will see all the problems in the document. If you move the highlight onto Problem 2, say, and press ¡ the pages of that problem will close up. Pressing · or /¤ takes you back to single page view on the page currently selected. Each page of a document contains one (or more) of the TI-Nspire applications. As a reminder, these are the same applications that can be accessed from the Home screen, i.e.
First Steps with TI-Nspire Tutorial 1: TI-Nspire documents ™ Contextual Menus Return to the Home screen, and select 2: My Docs… to access the document browser. Notice that within the document browser new folders may be created or folders renamed. Items that are grey, rather than black in a menu cannot be chosen in the current environment. For example, on the screen on the left, option 3: Save As… is unavailable. Pressing d will always close down a menu or dialog box.
First Steps with TI-Nspire Tutorial 1: TI-Nspire documents ™ Then open a document in the browser and press b again. It is important to realise that b will always provide access to the features of the current environment. For example, within the Notes application, this menu offers only the available options for that application (as shown to the right). There are a number of tools that are available for managing documents when you choose the use the Document menu by pressing the ~button.
First Steps with TI-Nspire Tutorial 2: The Calculator Application ™ Tutorial 2 The Calculator Application At the heart of TI-Nspire is the Calculator application, the workspace for numeric and algebra operations. This tutorial introduces some of the key features of the application, starting with a new blank document.
First Steps with TI-Nspire Tutorial 2: The Calculator Application ™ A History Lesson You will have noticed that, as new expressions are entered, previous ones scroll off the top of the screen. The TI-Nspire handheld will remember a history of up to 99 expressions and these can be recalled using the up key on the Touchpad. Press and hold £ and see the way the highlight flicks back through previous expressions and results. Stop at some point in the history and press ·.
First Steps with TI-Nspire Tutorial 2: The Calculator Application ™ Templates Many of the handheld’s keys provide templates to enable you to enter a range of mathematical expressions. For example, in this tutorial you have used the keys /q for square roots and l for powers. In both cases a small box appears in the expression inviting you to enter values. Some care is necessary when entering more complex expressions using such templates. For example, try entering √3+√5.
First Steps with TI-Nspire Tutorial 2: The Calculator Application ™ Getting Set The mode settings for a document can be changed using the document settings dialog box: press c521 or ~721 or Click on the icon then press 21 With dialog boxes it is important to remember that you need to press e to move through the various options. Document settings dialog box Notice that here the first box is outlined bold, showing that Display Digits is selected.
First Steps with TI-Nspire Tutorial 2: The Calculator Application ™ Some Algebra The calculator application allows you to define variables as single numbers, functions, lists, matrices and even strings. There are three equivalent ways to store a variable. You can use /h (store), or /t(Ï) or Define Define can be typed letter by letter, followed by a space or alternatively it can be entered from the Catalogue: press kD to find it.
First Steps with TI-Nspire Tutorial 2: The Calculator Application ™ The Calculator Menu Press b and look at the extensive system of menus and submenus available in the Calculator application. If you used the TI-83 or TI-84 graphical calculators you will be familiar with many of these expressions. More details can be found in the Getting Started Guide. This screen shows a simulation of 100 throws of two dice and uses commands from the Probability and Statistics sub-menus.
First Steps with TI-Nspire Tutorial 2: The Calculator Application ™ Variables Linked to Documents Press h and you will see a floating menu showing all the variables that you have defined while using the current document. When you load a different document these definitions will be replaced by those linked to that document. Make sure your list includes the variables g, h, d1 and d2 and then save the document, giving it the name FirstSteps. The Save As..
First Steps with TI-Nspire Tutorial 3: The Notes application ™ Tutorial 3 The Notes Page This very short tutorial introduces this simple, innovative application and deals with the process of splitting the screen. Why use Notes? TI-Nspire documents may be readily shared with others, so teachers can prepare and then distribute documents that are a type of electronic worksheet.
First Steps with TI-Nspire Tutorial 3: The Notes application ™ Press b to see the various options available when using the Notes application. Try to format some text. To select a block of text for formatting hold down the shift key, g, while you move around the text using the Touchpad. Splitting the Screen In any application you can split the screen into two or more parts using the Page Layout option in the Document menu.
First Steps with TI-Nspire Tutorial 3: The Notes application ™ More Options from the Notes Menu Mathematical expressions can be entered (and evaluated) on a Notes page. In addition the menus in the Notes application provide: • two templates for Q+A and Proofs • teacher and reviewer comments • small shapes such as ∆ Have a look at the examples of their use shown here. If you want to explore them choose the relevant options after pressing b.
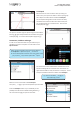
First Steps with TI-Nspire Tutorial 3: The Notes application ™ Asking Questions If you also have access to TI-Nspire Teacher Software, then you also have the ability to insert questions in to your documents. To do this you use the Insert menu and choose Question… There are a number of different question types which can be used In this example we’ve chosen the Custom Choice question type, this is a multiple choice template.
First Steps with TI-Nspire Tutorial 3: The Notes application ™ We then enter the question in the top box and answers in the fields below. To add mathematical content insert a Maths Box. To indicate the correct answer click on the Tick mark. When viewed on the handheld the question this will look like this. If the correct answer has been set then the question can be either self-marked by pressing b2, or marked by the teacher using TI Connect-to-Class or TI-Nspire Navigator Teacher software.
First Steps with TI-Nspire Tutorial 4: Graphing ™ Tutorial 4 Graphing The Graphs and Geometry applications are probably the most visually exciting of the TI-Nspire applications. This tutorial introduces the Graphs application and then concentrates on its use for graphing and exploring functions. The application’s use for creating and exploring geometrical shapes is covered in Tutorial 5. Graphs & Geometry: Two Views Start by opening the document FirstSteps4 that you created in Tutorial 3.
First Steps with TI-Nspire Tutorial 4: Graphing ™ Grab and Drag Practice Use the Touchpad to move the arrow around the work area, it behaves exactly like a trackpad on a laptop, so you do not need to press down on the pad just let your finger lightly touch it. As you move the cursor over the objects in the work area, three things may happen: • the cursor changes shape • the underlying object flashes • labels of the various objects appear, e.g. axes, graph etc.
First Steps with TI-Nspire Tutorial 4: Graphing ™ You have just used a direct method for changing the axes, but there are a number of other ways to do this. Press b4 and you will see this Window sub-menu. Option 1 allows you to enter numerical values to determine the extremes of the axes, while the Zoom options, as on the TI-83 and TI-84, provide automatic rescaling. The Zoom settings It is worth mentioning one final very useful way of changing the position of the axes, but without rescaling them.
First Steps with TI-Nspire Tutorial 4: Graphing ™ Tracing Graphs Press b51 to choose the Graph Trace option. Notice the Trace icon in the top left corner of the work area. This is typical of many of the options from the menus. Trace picks out significant points Press ¡ and ¢ to trace along the graph and see the coordinates of current points in the lower right corner.
First Steps with TI-Nspire Tutorial 4: Graphing ™ Notice that all the intersections are added at once and that their co-ordinates are automatically displayed. We will now use the Text tool: b16. Try labelling one of your fixed points by moving carefully to the point––make quite certain that only the point is highlighted and not one of the graphs or axes. Points, lines and shapes can be drawn and manipulated on the graphing work area and this will be explored in the next tutorial.
First Steps with TI-Nspire Tutorial 4: Graphing ™ Manually Moving Graphs You saw earlier that, when you change a function’s equation the graph changes. An innovative feature of TI-Nspire is that you can also do the reverse, i.e. manually manipulate the graph and see the function’s equation change. As the graph moves, all associated features such as points of intersection and their coordinates also update. First move the straight line graph, as follows.
First Steps with TI-Nspire Tutorial 4: Graphing ™ Next add a second function f4(x)=f3(x-d) by pressing eF3(X-D)·, this function is a transformation of the original function by d. Now grab the handle on the slider and move it left and right and observe the effect on the graph. Try changing the original function, or moving the position of d in f4 to explore other transformations.
First Steps with TI-Nspire Tutorial 4: Graphing ™ Check list of some key points in Tutorial 4: • Items visible in the graphing view: the work area, the entry line, the function history, the warning icons in the top-left corner • Grabbing and dragging labels • Setting the axes in three ways: by dragging, zooming and entering values • Tracing along graphs • Marking and labelling points and their coordinates • Using the Analyse Graph menu • Transforming graphs and their functions manually • Using Sliders Pag
First Steps with TI-Nspire Tutorial 1: TI-Nspire documents ™ Tutorial 5 Geometry This tutorial introduces interactive geometry in TI-Nspire and builds upon the methods and features of the Graphs and Geometry applications that were covered in Tutorial 4. You are led step by step through a geometrical construction which illustrates the simple concept that the areas of triangles with a fixed base and constant height are equal.
First Steps with TI-Nspire Tutorial 5: Geometry ™ The next step is to draw a line parallel to BC. This is a construction so you need to press bA. Choose option 2: Parallel. You must specify two things: the line to which it is to be parallel, and a point the line must pass though (although these can be chosen in either order). So move the cursor to the segment BC––you will see its label when you are in the right position.
First Steps with TI-Nspire Tutorial 5: Geometry ™ Making Measurements With a triangle drawn on your screen, the next step is to measure its area. Choose option 2: Area from the Measurement menu (b8) and then move the cursor to one of the sides of the triangle. The triangle label and the pointing-finger icon appear together with a calculated area in the background.
First Steps with TI-Nspire Tutorial 5: Geometry ™ Now move to the top of the screen and enter some text, perhaps giving the user some explanation or instructions. You will need to press: • b16 to select the Text option, • Then click to start a box where text can be entered. • Note you cannot do carriage returns in text boxes so do put in two lines you must use two text boxes! Dynamic Changes If you haven’t yet done so, try grabbing point A and sliding it along its line.
First Steps with TI-Nspire Tutorial 5: Geometry ™ This brings up the contextual menu which gives the options available for the option displayed. To change the shading select Colour then Line Colour or Fill Colour which will open a colour picker from which you can choose a colour. Now move the cursor to point B and right click again (/b). This gives you the contextual menu for the point, one option here is to Pin the point, which will prevent users from grabbing and moving it.
First Steps with TI-Nspire Tutorial 5: Geometry ™ Check list of some key points in Tutorial 5: • Use of the Plane Geometry View rather than the Graphing View • Lines, segments and rays • Constructing parallel lines • Drawing points on objects and labelling them • The construction of shapes • The difference between selecting and grabbing screen objects • Making a measurement and storing as a variable • Attributes which change the appearance and locking/pinning screen objects Page 40 © 2012 Texas Instrumen
First Steps with TI-Nspire Tutorial 6: Lists & Spreadsheet ™ Tutorial 6 Lists & Spreadsheet The Lists & Spreadsheet application is a very powerful means of manipulating data lists and works seamlessly with the other applications to provide multiple representations of data. This tutorial introduces the application, showing how to use it as a simple spreadsheet. It also shows how the Lists & Spreadsheet application handles lists and functions defined in the Calculator, and Graphs applications.
First Steps with TI-Nspire Tutorial 6: Lists & Spreadsheet ™ Using Formulae Suppose you wished to investigate the relationship between hand spans and shoe sizes. You might therefore wish to divide every hand-span measurement by the corresponding shoe size. These ratios would best be expressed in decimal rather than fractional format so change the Document Settings for Calculation Mode to Approximate (~721). There are 3 ways (at least!) of calculating the ratios on the TI-Nspire.
First Steps with TI-Nspire Tutorial 6: Lists & Spreadsheet ™ Capturing Data A powerful feature of TI-Nspire is its ability to capture data from a Graphs or Geometry page. Follow through these steps to see an example of how this works, using the measurement of the area of a triangle from Tutorial 5. • Create a new Lists & Spreadsheet page: (c then select • Choose the Manual Data Capture option from the menus (b322). You should see in the entry line: =capture(var,0). ).
First Steps with TI-Nspire Tutorial 6: Lists & Spreadsheet ™ Because function tables are so useful, they can also be drawn automatically. Follow through these steps. • Create another Lists & Spreadsheet page and press b51 to switch to a function table. Notice the different layout of the screen and a box with a list of the currently defined functions. • Choose a function and scroll up and down. • Press b5 again. These are the only options that are available now: apart from the ability to resize columns.
First Steps with TI-Nspire Tutorial 6: Lists & Spreadsheet ™ Frequency Charts Often due to the quantity of data it is more useful to work with data in the form of a frequency chart, this can be for either discrete or grouped data (using the midpoint). Let’s look at some more shoe size data but this time as a frequency chart. Create a new Lists & Spreadsheet page, then enter the following data, with the headings gshoe (grouped shoe size) and gfreq (grouped frequency).
First Steps with TI-Nspire Tutorial 7: One- and two-variable statistics ™ Tutorial 7 One and Two Variable Statistics One of the six core applications of TI-Nspire is Data & Statistics, the workspace for presenting, interpreting and manipulating statistical charts and graphs. This application works in combination with the Lists & Spreadsheet application and this tutorial uses the data that were entered as a spreadsheet at the beginning of Tutorial 6.
First Steps with TI-Nspire Tutorial 7: One- and two-variable statistics ™ Display the boxplot and then move the cursor over the chart. You will be able to see the median, quartiles, maximum and minimum values and, possibly, outlier values. Upper quartile displayed Comparing Boxplots This boxplot can be compared with a similar one representing the female shoe sizes by displaying them, one above another.
First Steps with TI-Nspire Tutorial 7: One- and two-variable statistics ™ Charts with Two Variables Create a new Data & Statistics page. Notice both axes are marked Click to add variable. As before select mshoe for the horizontal axis. Move the cursor to the left edge of the screen, click x and select the variable mhand for the vertical axis. This displays the scatterplot.
First Steps with TI-Nspire Tutorial 7: One- and two-variable statistics ™ Drawing the Regression Line The line that was fitted by hand and eye can be compared with the calculated linear regression line using option 4 in the Analyze menu. Pressing b461 will display a line with equation of the form y=mx+b. As usual, you can click and drag on the regression equation to move it to a convenient place. The calculated regression line Getting the Stats There are two methods for displaying summary statistics: 1.
First Steps with TI-Nspire Tutorial 7: One- and two-variable statistics ™ It is also possible to arrange side-by-side comparisons of corresponding summary statistics for two or more data sets and this makes drawing inferences from the statistics very quick and very clear. The best way to do this is to select more than one list above. Dragging on the Charts An interesting feature is the ability to drag plotted points around charts, thus changing the original data.
First Steps with TI-Nspire Tutorial 7: One- and two-variable statistics ™ Press b411 to start the One-Variable Statistics wizard, again choose 1 list (remember multiple lists are for when you want to calculate statistics for multiple lists at the same time). This time we set the X1 List to be ‘gshoe but change the Frequency List from 1 to ‘gfreq, and set the Results Column to be c (which is the first empty column).
First Steps with TI-Nspire Tutorial 7: One- and two-variable statistics ™ Check list of some key points in Tutorial 7 • Creating one- and two-variable statistical plots in the Data & Statistics application • Plotting categorical as opposed to numerical data • Using boxplots to compare data sets • Calculating and displaying summary statistics • Manually fitting straight lines to data • Automatically fitting linear-regression lines to data • Dragging points on a scatterplot • Working with Frequency Data Pa
First Steps with TI-Nspire Appendix: Multiple Representations ™ Appendix Multiple Representations The previous seven tutorials have introduced many of the key features of TI-Nspire learning technology, with each of the applications being discussed separately. However, one of the great strengths of TI-Nspire is that it allows the applications to be linked dynamically, encouraging different approaches to problem solving.
First Steps with TI-Nspire Appendix: Multiple Representations ™ A Spreadsheet for Data Capture • Open a new Lists & Spreadsheet page. • Type column headings for columns A to D. • Click in the function entry line in column A (grey cell just below the heading). • From the Data menu choose Automated Data Capture. Type r and press ·. This will capture values of the radius in column A. • Repeat for the other variables in columns B to D.
First Steps with TI-Nspire Appendix: Multiple Representations ™ Go to Town with Data Collection • Return to the Geometry page and drag the circumference in as far as you can. • Review the data in the spreadsheet. • Review the diameter/circumference scatter plot, using Zoom–Data to update the window settings. A linear relationship Fit a Straight Line • From the Analyze menu choose Add Movable Line. Drag it into place to fit the plotted points.
First Steps with TI-Nspire Appendix: Multiple Representations ™ A Different Approach to Scatterplots • Open a new Graphs page. • From the Graph Type menu choose Scatter Plot – b34. • Set x to be radius and y to be area. • From the Window menu choose Zoom–Data and hide the entry line to gain a good view of the data points including the horizontal axis. • Now choose Function from the Graph Type menu b31. The basic quadratic ready for fitting… • Enter f1(x)=x .