
User Manual
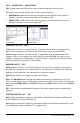
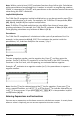
Table Of Contents
- Important Information
- Using Your TI-84 Plus CE Graphing Calculator
- Using the Keyboard
- Setting Up the Calculator Modes
- Evaluating Expressions
- Working with Graphs
- Working with Matrices
- Working with Probability and Statistics
- Working with Variables
- Managing Calculator Files
- Using Applications (Apps)
- Using Accessories
- Using Press-to-Test
- Diagnosing and Correcting Error Conditions
- General Information
- Index

20 Setting Up the Calculator Modes
THIN plotting mode resets all Y= line styles to a thin line connecting each point
calculated for the selected functions.
Note: Use THIN plotting mode for function graphing when looking at any functions
which asymptote to an axis.
DOT-THIN plotting mode resets all Y= line styles to a small dot and plots only the
calculated points of the selected functions.
SEQUENTIAL SIMUL
SEQUENTIAL graphing-order mode evaluates and plots one function completely before
the next function is evaluated and plotted.
SIMUL (simultaneous) graphing-order mode evaluates and plots all selected functions
for a single value of X and then evaluates and plots them for the next value of X.
Note: Regardless of which graphing mode is selected, the calculator will sequentially
graph all stat plots before it graphs any functions.
REAL a+bi re^(qi)
REAL mode does not display complex results unless complex numbers are entered as
input.
Two complex modes display complex results.
• a+bi (rectangular complex mode) displays complex numbers in the form a+bi. The
TI-84 Plus CE supports the n/d fraction template.
• re^(qi) (polar complex mode) displays complex numbers in the form
re^(qi).