
Application Guide

174 Graphs Application
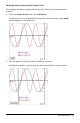
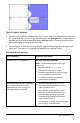
Graphing Equations
1. From the GraphEntry/Edit menu, select Equation.
2. Click the type of equation (Line, Parabola, Circle, Ellipse, Hyperbola, or Conic).
3. Click the specific template for the equation. For example, tap y=a•x
2
+b•x+c to
define a parabola.
The entry line includes a symbol to indicate the type of equation.
4. Type the coefficients into the equation template.
5. Press Enter.
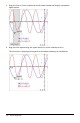
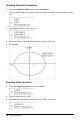
Graphing Conic Sections
The Graphing view lets you graph and explore linear and conic equations analytically in
a two-dimensional coordinate system. You can create and analyze lines, circles,
ellipses, parabolas, hyperbolas, and general conic equations.
The entry line makes it easy to enter the equation by displaying a template for the type
of equation you choose.
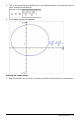
Example: Creating a conic ellipse
1. From the GraphEntry/Edit menu, select Equation>Ellipse, and tap the
equation type.