
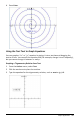
Application Guide

Graphing an Inequality from Text
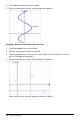
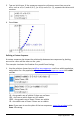
You can graph inequalities that use the >, <, ≤, or ≥ operators. Areas that satisfy the
inequality are shown with shading. If the shaded areas of two or more inequalities
overlap, the area of overlap is shaded darker.
1. From the Actions menu, select Text.
2. Click the work area to place the text box.
3. Type the inequality expression, such as x<2*sin(y). Click Enter to complete it.
4. Drag the text object to either axis to graph the inequality.
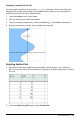
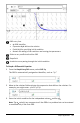
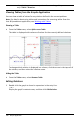
Graphing Scatter Plots
1. (Optional) Create two predefined list variables containing the x and y values to
plot. You can use the Lists&Spreadsheet, Calculator, or Notes application to create
the lists.
2. From the GraphEntry/Edit menu, select Scatter Plot.
Graphs Application 183