
Application Guide

184 Graphs Application
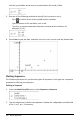
Use the up and down arrow keys to move between the x and y fields.
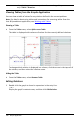
3. Use one of the following methods to specify lists to plot as x and y.
- Click to select names of the predefined list variables.
- Type the names of the variables, such as v1.
- Type lists as comma-separated elements enclosed within brackets, for
example: {1,2,3}.
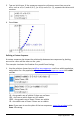
4. Press Enter to plot the data, and then zoom the work area to view the plotted data.
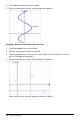
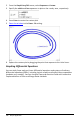
Plotting Sequences
The Graphs application lets you plot two types of sequences. Each type has a separate
template for defining the sequence.
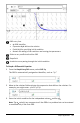
Defining a Sequence
1. From the GraphEntry/Edit menu, select Sequence > Sequence.
2. Type the expression to define the sequence. Update the independent variable field
to m+1, m+2, etc., if necessary.