
Application Guide

186 Graphs Application
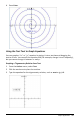
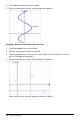
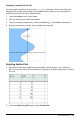
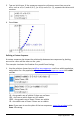
2. From the GraphEntry/Edit menu, select Sequence > Custom.
3. Specify the rabbit and fox sequences to plot on the x and y axes, respectively.
4. Press Enter to create the custom plot.
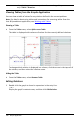
5. Zoom the window to the Zoom-Fit setting.
6. Explore the custom plot by dragging the point that represents the initial term.
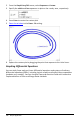
Graphing Differential Equations
You can study linear and non-linear differential equations and systems of ordinary
differential equations (ODEs), including logistic models and Lotka-Volterra equations
(predator-prey models). You can also plot slope and direction fields with interactive
implementations of Euler and Runge-Kutta methods.