
Application Guide

246 3D Graphs
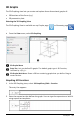
- x resolution (enter a value in range 2-200*, default=21)
- y resolution (enter a value in range 2-200*, default=21)
- transparency (enter a value in range 0-100, default=30)
* Handhelds are limited to a maximum display resolution of 21, regardless of the
value entered.
2. Set the attributes as you like, and then press Enter to accept the changes.
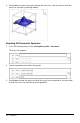
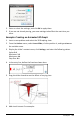
Showing or Hiding a Graph’s Label
▶ Display the graph’s context menu, and then click Hide Label or Show Label.
Showing and Hiding 3D Graphs
1. In the 3D Graphing view, select Actions > Hide/Show.
The Hide/Show tool appears, and all hidden items are displayed in gray.
2. Tap a graph to change its hide/show state.
3. To apply the changes and dismiss the tool, press Esc.
Note: If you want to show or hide only the graph's label, see Showing or Hiding a
Graph’s Label.
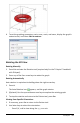
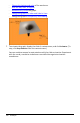
Customizing the 3D Viewing Environment
Setting the Background Color
▶ Display the context menu for the work area, and then click Background Color.
Showing or Hiding Specific View Elements
▶ From the View menu, click the item to show or hide. You can choose items such as
the 3D box, axes, box end values, and legend.
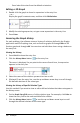
Changing the 3D Projection
▶ From the View menu, click OrthographicProjection or PerspectiveView.