
Application Guide

316 Lists&Spreadsheet Application
4. (Optional) Use the Data&Statistics features to analyze or visually enhance the
graph.
Note: For more information, see Using Data and Statistics.
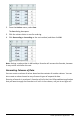
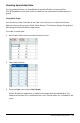
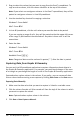
Creating a Summary Plot from a Summary Table
In this example, you create a summary table from raw data, and then use the table to
generate a summary plot. For more information, see Using Data&Statistics.
raw data summary table for eye color based on raw data