
Application Guide

318 Lists&Spreadsheet Application
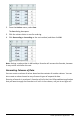
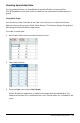
5. If necessary, use Tab and the arrow keys to select the correct lists for X List and
Summary List.
6. In the Display On field, select how to display the summary plot in the
Data&Statistics application.
• Select Split Page to place the chart on half of the current page.
• Select New Page to add the chart on a new page.
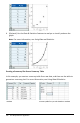
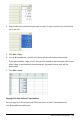
The summary plot is displayed with the list names along the axes and a summary
plot symbol in the lower left corner of the chart window.
Note: In this example, the XList contains string data, so the summary plot displays
as a bar chart. The category strings from the list display beneath the bars.
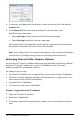
Exchanging Data with Other Computer Software
You can use the TI-Nspire™ desktop software to copy table data to and from software
outside the TI-Nspire™ applications, such as TIDataEditor (in the TIConnect™
software) and Excel® spreadsheet software.
For example, you can copy:
• The values of individual cells, a range of cells, or an entire list from TIDataEditor.
• The values (not the underlying formulas) of individual cells, a range of cells, or an
entire column from an Excel® spreadsheet.
• A number from TIDataEditor.
• The value of a matrix from TIDataEditor.
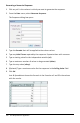
Example - Copying Data from TIDataEditor
1. Open the TIConnect™ software.
2. Display the TIDataEditor.
3. If necessary, open the file containing the number, list, or matrix that you want to
copy.