
Application Guide

The formula cell will contain an expression similar to =capture
(objpathX,1,objpathY).
7. Press Enter to complete the formula.
8. If you are capturing multiple columns of synchronized data, set up the additional
columns. For example, you might set up a second capture variable using
=capture(objpathY,1,objpathX).
9. When you are ready to capture the values, begin moving the object or start the
animation that affects it in Graphs&Geometry.
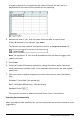
Each captured value is added to the end of the list.
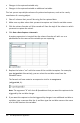
Using Table Data for Statistical Analysis
Tools on the Statistics menu provide access to wizards that help you perform statistical
analyses on the data in table columns. You specify the location of the data, and
Lists&Spreadsheet stores the results in two columns: one for the result names, and
one for the corresponding values.
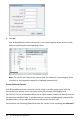
Plotting Statistical Data
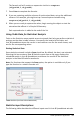
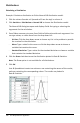
Some statistics wizards include a Draw check box. By default, the box is not selected.
Selecting this box creates a Data&Statistics work area on the page, displays the
calculated results in Lists&Spreadsheet, and draws the results of the statistical
analysis in the Data&Statistics work area.
Note: For functions that support the Draw option, the option is available only if you
type the function in a column formula cell.
Draw check box (as shown in the zTest wizard).
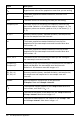
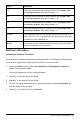
Statistics Input Descriptions
The following table describes the different inputs used in Lists&Spreadsheet wizards.
Lists&Spreadsheet Application 323