
Application Guide
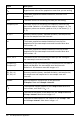
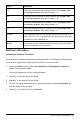

Input Description
x1 The count of successes from sample one for the 2-PropzTest
and 2-PropzInterval. Must be an integer|0.
x2 The count of successes from sample two for the 2-PropzTest
and 2-PropzInterval. Must be an integer|0.
n1 The count of observations in sample one for the 2-PropzTest
and 2-PropzInterval. Must be an integer >0.
n2 The count of observations in sample two for the 2-PropzTest
and 2-PropzInterval. Must be an integer >0.
C-Level The confidence level for the interval instructions. Must be |0
and <100. If it is |1, it is assumed to be given as a percent and
is divided by 100. Default=0.95.
RegEQ The prompt for the name of the function where the calculated
regression equation is to be stored.
Statistical Calculations
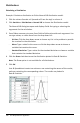
Performing a Statistical Calculation
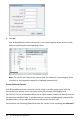
You can perform statistical calculations to analyze data. The following example fits a
y=mx+b linear regression model to the two lists in columns A and B.
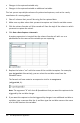
1. From the Statistics menu, select Stat Calculation > LinearRegression (mx+b) to
choose the regression model.
The Linear Regression (mx+b) dialog box opens.
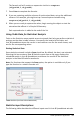
2. Type a[] as the column for the X List.
3. Type b[] as the column for the Y List.
4. To store the regression equation in a specified variable, replace Save RegEqn To
with the name of the variable.
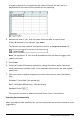
5. Type c[] as the column for the 1st Result.
Lists&Spreadsheet Application 325