
Application Guide

330 Lists&Spreadsheet Application
Distributions
Calculating a Distribution
Example: Calculate a distribution to fit the Normal Pdf distribution model.
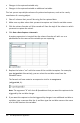
1. Click the column formula cell (second cell from the top) in columnA.
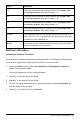
2. Click Statistics > Distributions > Normal Pdf to choose the Distribution model.
The Normal Pdf dialog box opens and displays fields for typing or selecting the
arguments for the calculation.
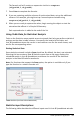
3. Press Tab as necessary to move from field to field and provide each argument. You
can type values, or select them from the drop down list:
- X Value: Click the drop-down arrow to choose any list in the problem to provide
the x values for the calculation.
- Mean: Type a value for the mean or click the drop-down arrow to choose a
variable that contains the mean.
- Standard Deviation: Type a value for the standard deviation or choose a variable
that contains the standard deviation.
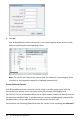
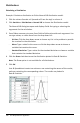
4. Click the Draw check box to see the distribution plotted in Data&Statistics.
Note: The Draw option is not available for all distributions.
5. Click OK.
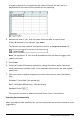
Lists&Spreadsheet inserts two columns: one containing the names of the results,
and one containing the corresponding values. The results are plotted in
Data&Statistics.