
Application Guide

332 Lists&Spreadsheet Application
This distribution is useful in determining the probability of an occurrence of any value
between the lower and upper bounds in the normal distribution. It is equivalent to
finding the area under the specified normal curve between the bounds.
Inverse Normal (invNorm)
Computes the inverse cumulative normal distribution function for a given area under
the normal distribution curve specified by mean, μ, and standard deviation, s.
This distribution is useful in determining the x-value of data in the area from 0 to x<1
when the percentile is known.
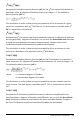
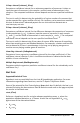
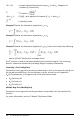
tPdf (tPdf)
Computes the probability density function (pdf) for the t-distribution at a specified x
value. df (degrees of freedom) must be >0. The probability density function (pdf) is:
This distribution is useful in determining the probability of the occurrence of a value
when the population standard deviation is not known and the sample size is small. The
draw option is available when tPdf is invoked from a formula cell.
tCdf (tCdf)
Computes the Student-t distribution probability between LowerBound and
UpperBound for the specified df (degrees of freedom). You can click the Draw (Shade
area) check box to shade the area between the bounds. Changes to the initial
LowerBound and UpperBound automatically update the distribution.
This distribution is useful in determining the probability of the occurrence of a value
within an interval defined by the lower and upper bound for a normally distributed
population when the population standard deviation is not known.
Inverset (invt)
Computes the inverse cumulative t-distribution probability function specified by
Degrees of Freedom, df, for a given area under the curve.
This distribution is useful in determining the probability of an occurrence of data in the
area from 0 to x<1. This function is used when the population mean and/or population
standard deviation is not known.