
Application Guide

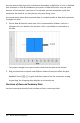

▶ Click the variable name displayed after Caption to use the caseplot.
- Choose <None> to remove the default caseplot.
- Choose the name of a variable to have it replace the current caseplot variable.
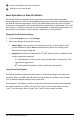
- Hover over any data point to see the summary information.
- Drag any data point toward an axis to see how the points group.
- Activate the Graph Trace tool and press ◄or► to move across points.
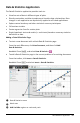
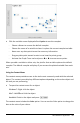
When you add a variable to either axis, the plot for that variable replaces the default
caseplot. The default caseplot redisplays if you remove the plotted variable from each
axis.
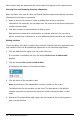
Using the Context Menu
The context menu provides access to the tools most commonly used with the selected
object. The context menu displays different options depending on the active object and
the task you are performing.
▶ To open the context menu for an object.
Windows®: Right-click the object.
Mac®: Hold “ and click the object.
Handheld: Point to the object and press / b.
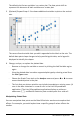
The context menu includes the Color option. You can use the Color option to change the
data to the color of your choice.
Data&Statistics Application 347