
Application Guide


348 Data&Statistics Application
Other options that are appropriate for various plots also appear on the context menu.
Selecting Data and Displaying Summary Information
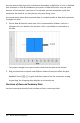
When you hover over part of a plot, the Data&Statistics application displays summary
information for the data it represents.
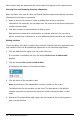
1. Hover at an area of interest in a plot to display data values or summary
information. For example, you can hover over the center of a box plot to display the
median summary data.
2. Click once to select a representation of data in a plot.
Data points are shown with a bold outline to indicate selection. You can click a
point a second time to deselect it, or click additional points to add to the selection.
Plotting Variables
To plot variables, start with a problem that includes a Data&Statistics application and
lists created in the Lists&Spreadsheet application or the Calculator application.
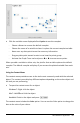
1. Click the Add Variable region near the center of an axis.
If no variable is plotted on the axis, the tooltip Click or Enter to add variable
displays.
2. Click the tooltip Click or Enter to add variable.
A list displays the names of available variables.
3. Click the name of the variable to plot.
Note: By convention, the independent variable is shown on the x-axis.
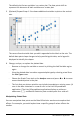
The default plot for one variable is a dot chart. The data points in the default
caseplot reposition to represent the elements of the selected variable in a dot
chart.
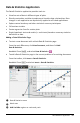
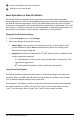
4. (Optional) Click the Add Variable region near the center of the remaining axis to
plot a second variable.