
Application Guide
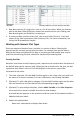


A modified box plot displays on the Data&Statistics work area.
Note: You can split a box plot by category by adding a list that contains
corresponding categorical data to the y-axis.
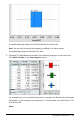
3. (Optional) To add additional variables for comparing box plots on the same axis,
click Add X Variable on the Plot Properties menu.
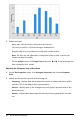
For example, you can use multiple box plots to compare the distributions of sample
proportions. In the example, true proportion is .5 and sample size varies from n=20
to n=40 to n=90.
Notes:
Data&Statistics Application 353