
Application Guide


356 Data&Statistics Application
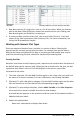
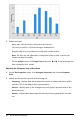
4. Explore the data.
- Hover over a bin to see the information for that bin.
- Click a bin to select it. Click the bin again to deselect it.
- Drag the side of a bin to adjust bin width and number of bins.
Note: The bins are not adjustable in categorical plots or plots in which you
choose variable bin widths.
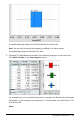
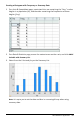
- On the Analyze menu, click Graph Trace and press ◄or► to cycle through the
bins and display their values.
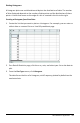
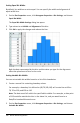
Adjusting the Histogram Scale of Raw Data
1. On the Plot Properties menu, click Histogram Properties and choose Histogram
Scale.
2. Choose the format for the scale of the histogram.
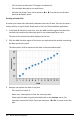
- Frequency - displays data based upon the number of values that occur within
each bin. This is the default data representation.
- Percent - displays data in the histogram by each group’s percent value of the
whole data set.
- Density - displays data based upon the density of each group within the data
set.