
Application Guide


Creating a Histogram with Frequency or Summary Data
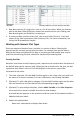
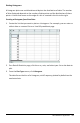
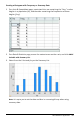
1. On a Lists&Spreadsheet page, create two lists: one containing the “bins,” such as
heights in a population (ht), and the other containing the frequencies of those
heights (freq).
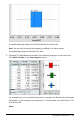
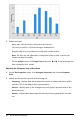
2. On a Data&Statistics page, access the context menu on the x axis, and click Add X
Variable with Summary List.
3. Select ht as the X List and freq as the Summary List.
Note: It is up to you to set the data and bins in a meaningful way when using
summary data.
Data&Statistics Application 357