
Application Guide

368 Data&Statistics Application
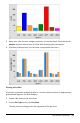
Splitting a Numeric Plot by Categories
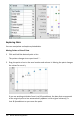
You can use a categorical split to sort the values plotted on an axis.
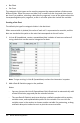
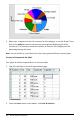
1. Open a problem that includes a Lists&Spreadsheet page, or create data to be
plotted in the Lists&Spreadsheet application.
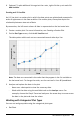
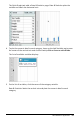
In this example, lists contain dog breed and daily walk information.
2. Click column letter (B).
3. On the Lists&Spreadsheet Data menu, click the Quick Graph tool.