
Application Guide

374 Data&Statistics Application
area, you cannot create a box plot without first removing the variable from the y-
axis.
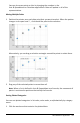
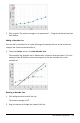
Rescaling a Graph
You can change the scale of the axes by using Translation and Dilation. The pointer
changes to indicate whether Translation (ö) or Dilation (ô) is available in zones on the
axes.
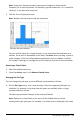
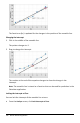
Translation
A translation slides a set of axes a fixed distance in a given direction. The original axes
have the same shape and size.
1. Position the pointer over a tic mark or label in the middle third of the axis. The
pointer changes to ö.
2. Click to grab. The pointer changes to a grasping hand ù. Drag to the desired
position and release.
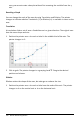
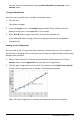
Dilation
Dilation retains the shape of the axes, but enlarges or reduces the size.
1. Position the pointer over a tic mark or label near the ends of the axis. The pointer
changes to ó on the vertical axis or ô on the horizontal axis.