
Application Guide
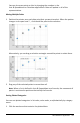
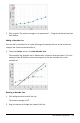

2. Click to grab. The pointer changes to an open hand ÷. Drag to the desired position
and release.
Adding a Movable Line
You can add a movable line to a plot. Moving and rotating the line on the work area
changes the function that describes it.
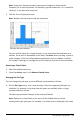
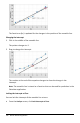
▶ From the Analyze menu, click Add Movable Line.
The movable line displays and is labeled with a function that describes it. For this
example, Data&Statistics stores the expression for the movable line in the
variable m1.
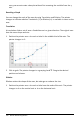
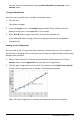
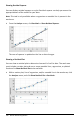
Rotating a Movable Line
1. Click and grab either end of the line.
The pointer changes to é.
2. Drag to rotate and change the slope of the line.
Data&Statistics Application 375