
Application Guide

378 Data&Statistics Application
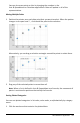
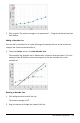
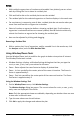
Showing Residual Squares
You can display residual squares on a plot. Residual squares can help you assess the
appropriateness of the model for your data.
Note: This tool is only available when a regression or movable line is present in the
work area.
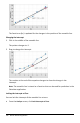
▶ From the Analyze menu, click Residuals > Show Residual Squares.
The sum of squares is updated as the line or data changes.
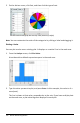
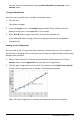
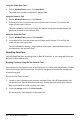
Showing a Residual Plot
You can show a residual plot to determine how well a line fits data. The work area
must include a scatter plot and one or more movable lines, regressions, or plotted
functions for Show Residual Plot to be available.
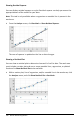
▶ With a scatter plot, line of regression, and/or movable line in the work area, click
the Analyze menu, and click Show Residual Plot > Residuals.