
Application Guide

Notes:
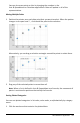
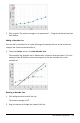
• With multiple regressions or functions and movable lines plotted, you can select
each by clicking the line to show its residual plot.
• Click and hold a dot on the residual plot to see the residual.
• The residual plot for the selected regression or function displays in the work area.
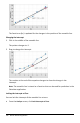
• For consistency in comparing sets of data, residual plots do not rescale when you
move from one function or regression to another.
• Select a function or regression before a showing residual plot. If no function or
regression is selected and there are several plotted, Data&Statistics arbitrarily
selects the function or regression for showing the residual plot.
• Axes can be adjusted by clicking and dragging.
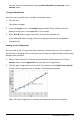
Removing a Residual Plot
▶ With a scatter plot, line of regression, and/or movable line in the work area, click
the Analyze menu, and click Hide Residual Plot.
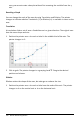
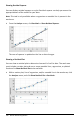
Using Window/Zoom Tools
Use the Window/Zoom tools to redefine the graph to better view points of interest.
The Window/Zoom tools include:
• Window Settings: displays a Window Settings dialog box that lets you type the
x-min, x-max, y-min, and y-max values for the axes.
• Zoom - Data: adjusts the zoom factor to display all plotted data.
• Zoom - In: lets you define the center point of the zoom in location. The Zoom In
factor is approximately 2.
• Zoom - Out: lets you define the center point of the zoom out location. The Zoom
Out factor is approximately 2.
Using the Window Settings Tool
1. On the Window/Zoom menu, click Window Settings.
The Window Settings dialog box opens. The current values for x-min, x-max, y-min,
and y-max are displayed in the fields.
Note: Only the appropriate boxes are editable, depending on whether there are one
or two axes in the work area.
2. Type the new values over the old values.
3. Click OK to apply the changes and redraw the plot.
Data&Statistics Application 379