
Application Guide

380 Data&Statistics Application
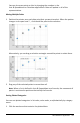
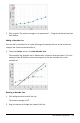
Using the Zoom Data Tool
▶ On the Window/Zoom menu, click Zoom Data.
The work area rescales to display all plotted data.
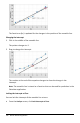
Using the Zoom In Tool
1. On the Window/Zoom menu, click Zoom In.
2. In the work area, click the center point of the area of interest. This will be the
center of the zoom in action.
The plot redraws to focus and enlarge the portion of the plot centered about the
point you selected in the previous step.
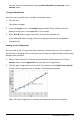
Using the Zoom Out Tool
1. On the Window/Zoom menu, click Zoom Out.
2. In the work area, click the center point of the area of interest. This will be the
center of the zoom out action.
The plot redraws to display a larger portion of the plot, centered about the point
you selected in the previous step.
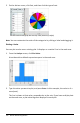
Graphing Functions
You can graph functions by typing them in Data&Statistics, or you can graph functions
defined in other applications.
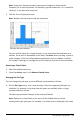
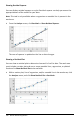
Graphing Functions Using the Plot Function Tool
You can use the Plot Function tool to plot functions in a work area that already includes
a plot on the axes. Plot Function lets you specify and graph a function for comparison
to an existing plot.
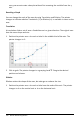
To use the Plot Function tool:
1. Create or open a problem that includes variables (from Lists&Spreadsheet) that
are plotted on a Data&Statistics work area. Ensure that your work area contains
both a horizontal axis and a vertical axis scale.
2. From the Analyze menu, click Plot Function.
A function entry field displays in the work area.