
Application Guide

386 Data&Statistics Application
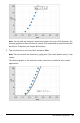
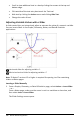
• Use plot value to set the boundary to an exact number. When a boundary for
shading is set to a plotted value, you can change the plotted value to update
the shading.
• Edit a shaded region by clicking and dragging the edge at the starting or ending
boundary.
Using Graph Trace
Graph Trace lets you move from one point on a graph to another to analyze variations
in the data. You can use Graph Trace mode to explore the data for the following
graphs.
• Graphs from Plot Function and Show Normal PDF
• Distribution curves (created in the Lists&Spreadsheet application)
• Movable Lines
• Regressions
• Caseplots
• Dot plots
• Scatter plots and X-Y line plots
• Box plots
• Histograms
• Bar charts
• Pie charts
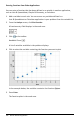
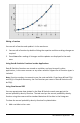
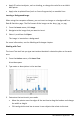
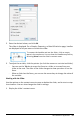
To use Graph Trace
1. From the Analyze menu, click Graph Trace.
2. Press ◄or► to move across the plot.
The data representations enlarge and appear with a bold outline as you move
across them in Trace mode.
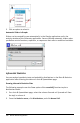
Customizing Your Workspace
Working with Color
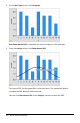
All data points for a plotted variable display in the same color to distinguish them from
the data points of other variables. Data plotted by category and split plots are
automatically displayed in different colors to help you distinguish the data.
To emphasize or distinguish certain parts of your work, you can change the default
color for a variable’s data.