
Application Guide

390 Data&Statistics Application
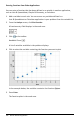
2. Click an option to select it.
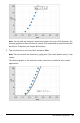
Automatic Sliders in Graphs
Sliders can be created for you automatically in the Graphs application and in the
analytic window of the Geometry application. You are offered automatic sliders when
you define certain functions, equations, or sequences that refer to undefined variables.
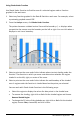
Inferential Statistics
You can explore hypothesis tests and probability distributions in the Data&Statistics
application after entering the data on a Lists&Spreadsheet page.
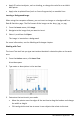
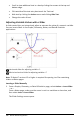
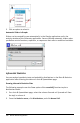
Drawing Inferential Statistics Plots
The following example uses the Draw option of the normCdf() function to plot a
distribution model.
1. On a Lists&Spreadsheet page, select the column-formula cell (second cell from
the top) in columnA.
2. From the Statistics menu, click Distributions, and click NormalCdf.