
Application Guide

If page layout options allow, the graph appears on the same page as the function or
relation. Otherwise, the graph appears on a separate Graphs page.
The type of graph created depends on:
• The type of function or relation.
• Any restrictions imposed by an active Press-to-Test session.
Example of Graphing from Notes
This example uses a Notes page to explore a quadratic function interactively.
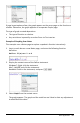
1. Insert a math box on a new Notes page, and enter the following function
definition:
Define f1(x)=x
2
-1·x-4
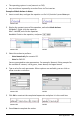
2. Display the context menu of the Define statement.
Windows®: Right-click the statement.
Mac®: Hold “, and click the statement.
Handheld: Point to the statement, and press / b.
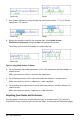
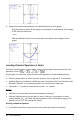
3. Select Graph from the context menu.
The graph appears. The graph and the math box are linked so that any adjustment
to one affects the other.
Notes Application 405