
Application Guide
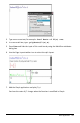


d) Deactivate the math expression box using Actions > Deactivate. The
deactivation will prevent the content of that math box from being overwritten
when the values for num and sampmeans change. The deactivated math box
will be shown with the light color background.
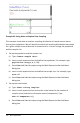
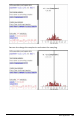
3. Set up Data&Statistics for the sampling.
a) Change the page layout and insert Data&Statistics.
b) Click on the horizontal axis and add sampmeans list.
c) Change the window setting: XMins=1 and XMax = 50.
d) You can also set up the plot of the mean of sample means using Analyze > Plot
Value.
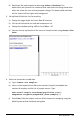
4. Enter the instructions to add data.
a) Type Create new samples:
b) Insert a math expression to define the sample (sample) and update the
number of samples and the list of sample means. Type:
num:=num+1:sample:=randsamp(population,size):
sampmeans:=augment(sampmeans,{mean(sample)})
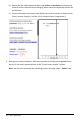
c) Press Enter, hide the output, and turn off the expression wrapping using the
Math Expression Box Attributes dialog box.
Notes Application 413