
Application Guide
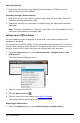

3. From the Experiment menu, select Collection Mode > Events with Entry.
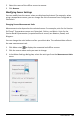
The Events with Entry Setup dialog box opens.
- Name. This text is visible in the Meter View. Its first letter is displayed as the
independent variable in the Graph view.
- Units. This text is displayed in Graph view alongside the Name.
- Average over 10 s. This option averages ten seconds of data for each point.
4. Modify sensor settings as necessary.
5. Click Start Collection .
The Keep Current Reading icon becomes active. The current sensor value
appears in the center of the graph.
6. Click Keep Current Reading to capture a sample.
The Events with Entry dialog box opens.
7. Type a value for the independent variable.
8. Click OK.
The data point is plotted, and the current sensor value appears in the center of the
graph.
Note: If you selected the Averaging option, a countdown timer appears. When the
counter reaches zero, the system plots the average.
9. Repeat steps 6 through 8 until you collect all of the desired data points.
10. Click Stop Collection .
The data set run is complete.
Data Collection 429