
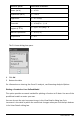
Application Guide

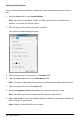

1. Click Analyze > Tangent.
A check mark appears in the menu next to the option.
2. Click the graph.
The examine indicator is drawn to the nearest data point.
The values of the plotted data are shown in the View details area and the All
Details for Graph dialog box.
You can move the examine line by dragging, clicking another point, or using the
arrow keys.
Interpolating the Value Between Two Data Points
Use Interpolate to estimate the value between two data points and to determine the
value of a Curve Fit between and beyond these data points.
The examine line moves from data point to data point. When Interpolate is on, the
examine line moves between and beyond data points.
To use Interpolate:
1. Click Analyze > Interpolate.
A check mark appears in the menu next to the option.
2. Click the graph.
The examine indicator is drawn to the nearest data point.
The values of the plotted data are shown in the View Details area.
You can shift the examine line by moving the cursor with the arrow keys or by
clicking on another data point.
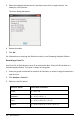
Generating Statistics
You can generate statistics (minimum, maximum, mean, standard deviation, and
number of samples) for all the collected data or for a selected region. You can also
generate a curve fit based on one of several standard models or on a model that you
define.
1. Leave the graph unselected to examine all the data, or select a range to examine a
specific area.
2. Click Analyze > Statistics.
Data Collection 443