
Application Guide


444 Data Collection
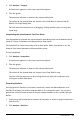
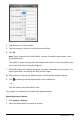
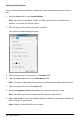
3. Select the plotted column name if you have more than a single column. For
example, run1.Pressure.
The Stats dialog box opens.
4. Review the data.
5. Click OK.
For information on clearing the Statistics analysis, see Removing Analysis Options.
Generating a Curve Fit
Use Curve Fit to find the best curve fit to match the data. Select all of the data or a
selected region of data. The curve is drawn on the graph.
1. Leave the graph unselected to examine all the data, or select a range to examine a
specific area.
2. Click Analyze > Curve Fit.
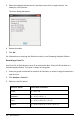
3. Select a curve fit option.
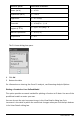
Curve Fit option Calculated in the form:
Linear y=m*x+b
Quadratic y=a*x^2+b*x+c
Cubic y=a*x^3+b*x^2+c*x+d
Quartic y=a*x^4+b*x^3+c*x^2+d*x+e