
Application Guide


4. Type the value for the variables.
5. Type the change in value in the Spin Increment fields.
6. Click OK.
Note: These values are the initial values. You can also adjust these values in the
View Details area.
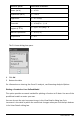
The model is shown on the graph with adjustment options in the View Details area
and in the All Details for Graph dialog box.
7. (Optional) Adjust the window setting for minimum and maximum axis values. For
more information, see Setting the Axis for One Graph.
For information on clearing the Model analysis, see Removing Analysis Options.
8. Click to make any desired adjustments to the coefficients.
—or—
Click the value in the View Details area.
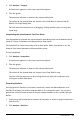
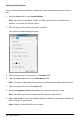
This graphic is an example of a model with adjusted values.
Removing Analysis Options
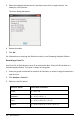
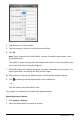
1. Click Analyze > Remove.
2. Select the data display you want to remove.
Data Collection 447