
Application Guide


448 Data Collection
The display you selected is removed from the graph and the View Details area.
Displaying Collected Data in Graph View
When you collect data, it is written in both the Graph and Table views. Use the Graph
view to examine the plotted data.
Important: The Graph menu and Analyze menu items are only active when working in
Graph View.
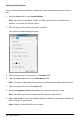
Selecting the Graph View
▶ Click the Graph View tab .
Viewing Multiple Graphs
Use the Show Graph menu to show separate graphs when using:
• A sensor that plots more than one column of data.
• Multiple sensors with different defined units at the same time.
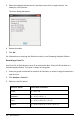
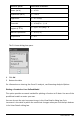
In this example, two sensors (the Gas Pressure sensor and the Hand Dynamometer)
were used in the same run. The following image shows the columns Time, Force, and
Pressure in the Table view to illustrate why two graphs are shown.
Displaying One of Two Graphs
When two graphs are displayed, the top graph is Graph 1 and the bottom graph is
Graph 2.
To display only Graph 1:
▶ Select Graph > Show Graph > Graph 1.
Only Graph1 is displayed.
To display only Graph 2:
▶ Select Graph > Show Graph > Graph 2.
Only Graph 2 is displayed.
Displaying Both Graphs
To display both Graph 1 and Graph 2 together:
▶ Select Graph > Show Graph > Both.