
Application Guide

456 Data Collection
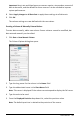
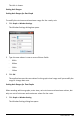
2. Type the new values in one or more of these fields:
- X Min
- X Max
- Graph 1: Y Min
- Y Max
- Graph 2: Y Min
- Y Max
3. Click OK.
The application uses the new values for the graph visual range until you modify the
range or change data sets.
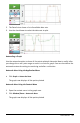
Setting the Axis Range on the Graph Screen
You can modify the minimum and maximum range for the x and y axes directly on the
graph screen.
▶ Select the axis value that you want to change, and type a new value.
The graph is redrawn to reflect the change.
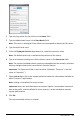
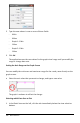
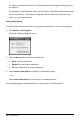
Selecting which Data Sets to Plot
1. In the Detail view on the left, click the tab immediately below the view selection
buttons.