
Application Guide

460 Data Collection
If a Zoom In precedes a Zoom Out, the graph displays the original settings prior to
the Zoom In.
For example, if you Zoomed In twice, the first Zoom Out would display the window
of the first Zoom In. To display the full graph with all data points from multiple
zoom ins, use Autoscale Now.
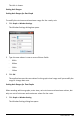
Setting Point Options
To indicate how often marks show on the graph and whether to use a connecting line:
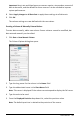
1. Click Options > Point Options.
The Point Options dialog box opens.
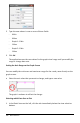
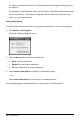
2. Select a Mark option from the drop-down list.
• None. No point protectors.
• Regional. Periodic point protectors.
• All. Every data point as a point protector.
3. Select Connect Data Points to display a line between points.
—or—
Clear Connect Data Points to remove the line between points.
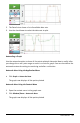
The following graphics show examples of some of the Point Mark options.